

Analytics - the Quick View tab
Your performance at a glance
A summary of easy to understand widgets, helping you focus on what's important to save you time.
View it whenever you want 24/7
Choose the time frame to suit: today, yesterday, this week, last week, this month or last month. The system updates it all automatically.
Helps you make data-driven decisions to improve your service faster and more efficiently

The Quick View widgets in more detail
FILTERS - view the data the way you want

Experience point/group
View specific branch device feedback individually or ALL devices together.
Survey Question
View your current survey or past ones with associated feedback data.
Time period
Choose to view feedback from today, yesterday, this week, last week, this month or last month.
Comparison
Compare current feedback from the same period (e.g. 1 day ago, 1 week ago, 4 weeks ago, 1 year ago) to quickly see if your improvements are working.
SUMMARY
Uses your Happy Index to compare performance with previous periods.
Your Happy Index is a score automatically calculated as the weighted average of the four smileys.
Shown in the reports as a blue line and indicates how good the results are with the higher the Happy Index, the better your performance.

Your performance at a glance
Shows if your Happy Index has risen (or fallen) over the period and by how much.
Shows the total number of feedbacks received and breaks them down into the 4 smiley faces by number of responses and percentage of total.
Bench marks your performance against the industry average (based on over 1 million data points every day).
Identifies your best & worst hours over the period in question.
Identifies your best & worst days of the week as above.
TOP FOLLOW UPS
Smiley Touch, Smiley Digital and Smiley Link
Follow Ups show what people like ("Highlights") and don't like ("Pain Points").
Ranks all Follow Ups in order, making it easy for you to identify what changes are needed.
You choose the follow up icons to suit your business needs.

Compares performance with previous periods and whether the number has risen or fallen.
In this example, 301 customers were unhappy with the Wait Time, up on the previous period by 23 which could be easily addressed by opening more tills or adding customer-facing staff.
Latest Open Feedback comments and which device they came from
Total number of Open Feedback comments in the period so far.
RESULTS

AN easy to read chart showing your feedback grouped in daily columns for the period in question.
Format shows how your Very Happy feedbacks (dark green) compare to your others.
The blue line represents the changes in your daily Happy Index (the higher the better) with the grey line being the previous period's Happy Index for comparison.
Ranking Comparison
Easy to compare performance across your organisation

Compares your branch performances ranking each by their Happy Index.
Shows which branches have improved and which have not and by how much.
Quickly identify the top performers and share best-practice throughout your organisation.
Set branch Happy Index targets and rewarding the right teams.
Hourly Pattern
Heat map shows you when the problems are happening

Builds a really useful hourly heat map identifying hot spots during the working day. Operations should be asking 'what's happening between 2 and 4pm most weekdays and why is not happening on Tuesdays or the weekend?"
Shows when people are happiest and unhappiest.
Easy to cross-check against tills receipts to see if happy customers equals increased sales.
Weekly Pattern
Heat map shows you when the problems are happening
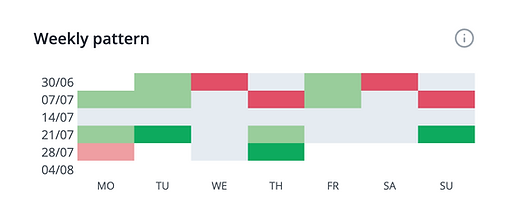
Builds a useful weekly heat map to quickly identify hot spots.
Shows when people are happiest and unhappiest during the week.