

The HappyOrNot Reporting Service
Business insights you can actually use
Our cloud-based Reporting Service helps you easily track and manage performance.
It translates your feedback into clear easy-to-read charts.
Intuitive widgets help you identify your service highs and lows.
Even better, you'll see what's making them happy or unhappy.
Letting you make those data-driven improvement decisions
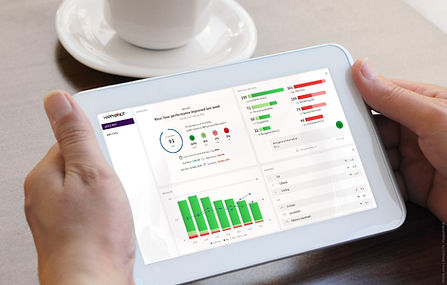
You can view your feedback data 24/7 via the web or the App (iOS/Android)
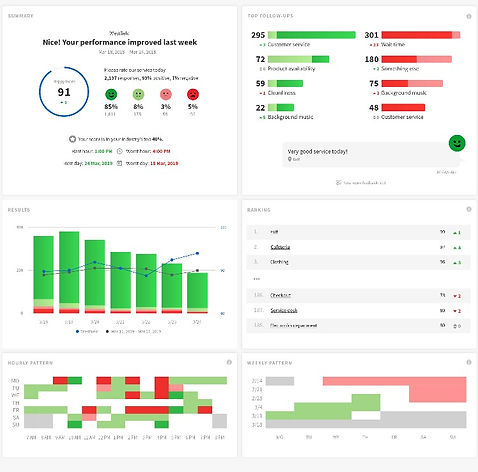
QUICK VIEW
your performance at a glance
Quick View gives you an instant overview of your key performance targets all summarised in easy-to-read widgets.
It helps you focus on what's important, and saves you time.
Full region and unit level benchmarking controls.
Use the Happy Index or NPS as your Key Performance Indicator.
Real-time performance benchmarking against previous periods and with hourly patterns.
Ranking - easily compare branch/location performance in a league table format.
Auto-refreshing views for back-office monitoring.
DETAILS
the powerhouse behind our smileys
The Details section shows your feedback results in interactive charts to help you pinpoint exact times and places of service problems and to identify long-term trends
The drill-down functionality and data exporting gives you full control to analyse your past and current performance results, so you can make more informed decisions for the future success of your business.
With HappyOrNot's uniquely trained feedback model, you get instant, unbiased visibility into customer sentiment, trends, and root causes, all tied to specific times and locations.
No manual analysis needed. Just reliable, easy-to-understand insights that help you improve experiences, drive loyalty, and make data-backed decisions with confidence.


Compare performance between locations, identify problems and introduce best practice to any under performing locations.

Performance Reports
Period reports automatically emailed to you and your team
The easiest way to share your HappyOrNot results within the organisation.
Local and regional level reports.
Daily and weekly reports are great tools for improving performance across units.
